
Insights
Insights is the platform's performance view across every tenant — how much they sell, who leads, and who needs attention.
What you'll learn
- What the headline metrics track
- How to read the trend chart and leaderboard
- How to spot tenants that need attention
Reading the metrics
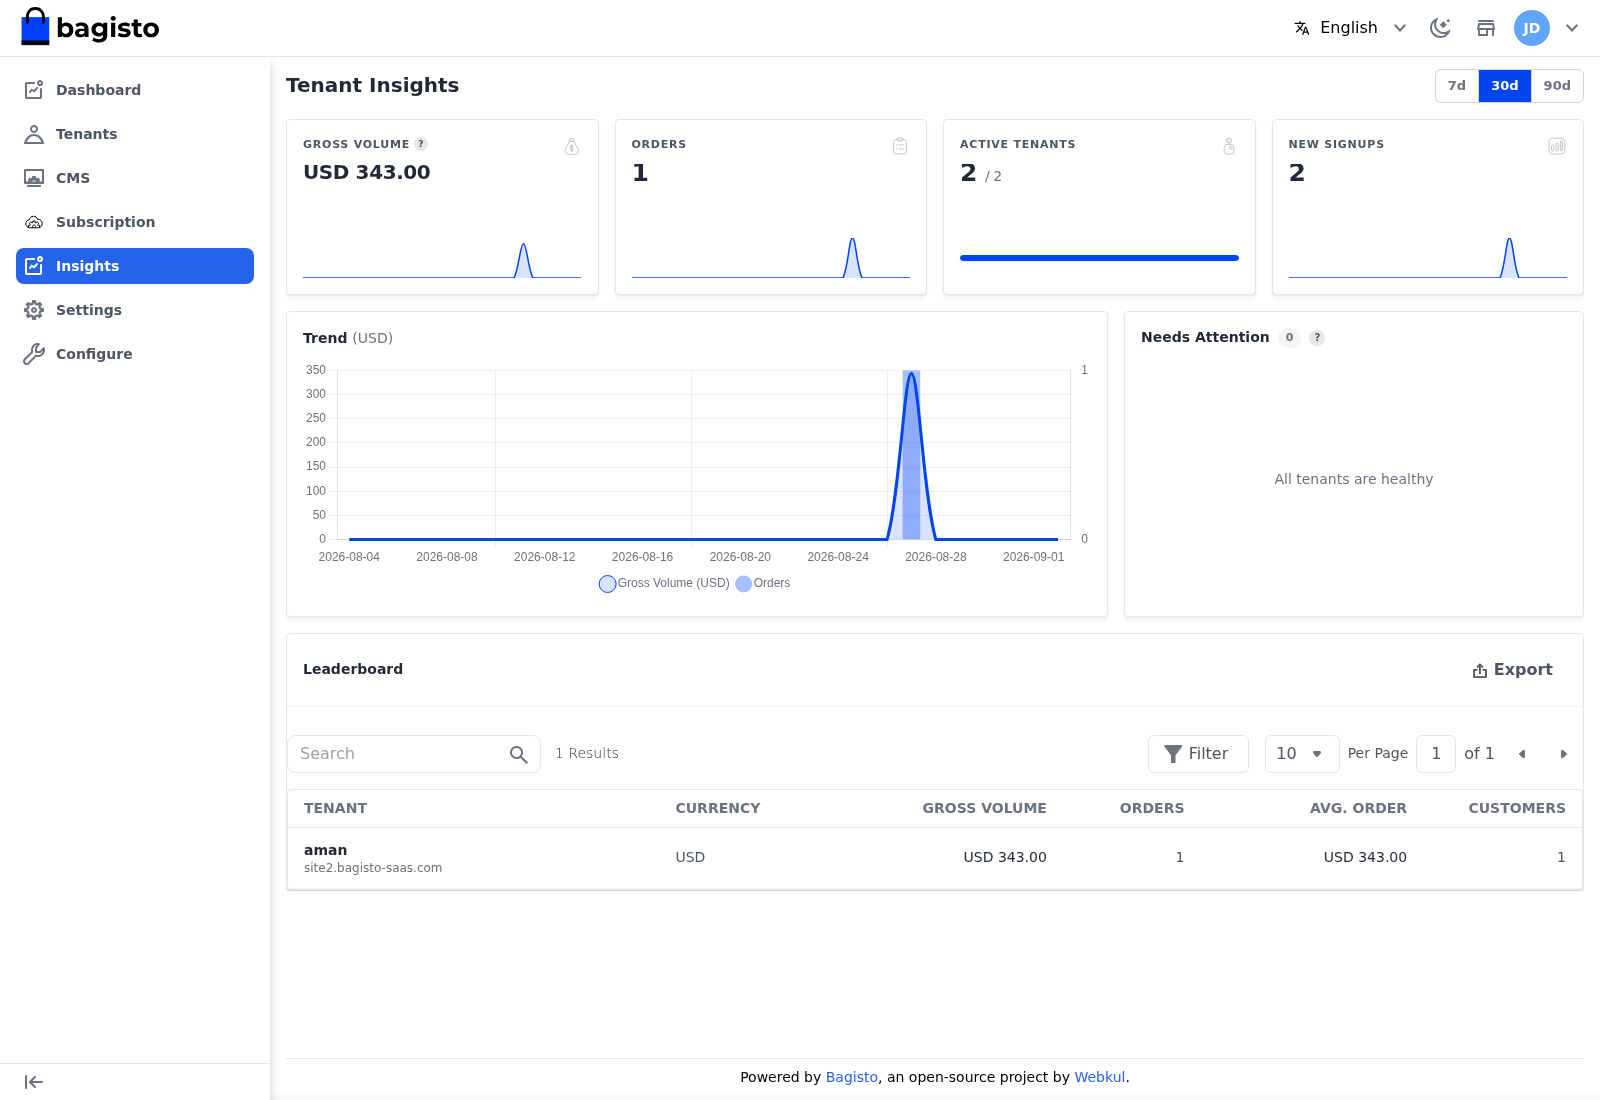
Go to Insights. The top cards summarise the selected period, which you switch between 7d, 30d, and 90d:
- Gross Volume — total sales value across all tenants.
- Orders — total orders placed across all tenants.
- Active Tenants — how many tenants are active, out of the total.
- New Signups — tenants that joined in the period.
Trend, attention and leaderboard
Below the cards:
- Trend plots gross volume and orders over time, so you can see momentum at a glance.
- Needs Attention flags tenants that require a look; when everything is healthy it says so.
- Leaderboard ranks tenants by gross volume, orders, average order, and customers. Use Export to download it.
TIP
Use the leaderboard to find your strongest tenants and the Needs Attention panel to catch struggling ones early — then open a tenant from Tenant Management to dig in or sign in as them.